
Network Analytics Platform
Built for Service Provider. Scalable to millions of devices.
Loaded with network operation expertise.
Deployed on Tier1 Service Providers.
Used by thousands of people.
/// Use cases
That’s what we solve when b.lo is in your network (Just some examples)

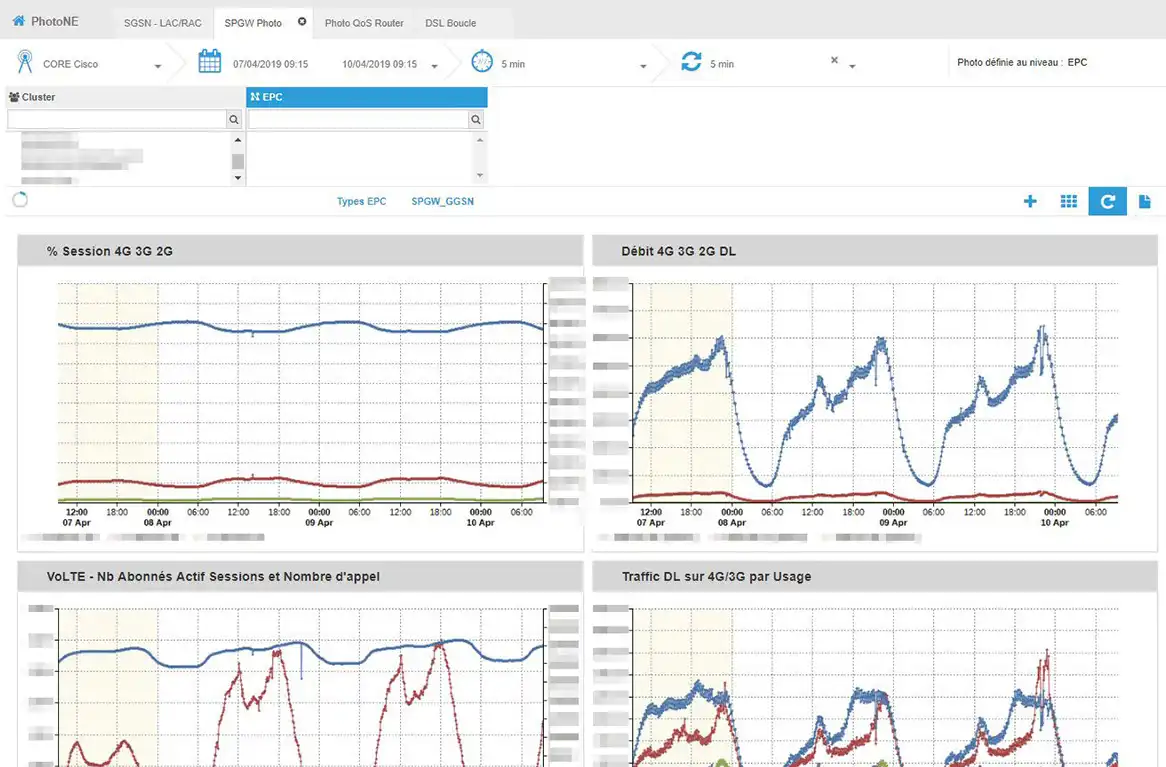
Report the services causing the rise of traffic on the core network.
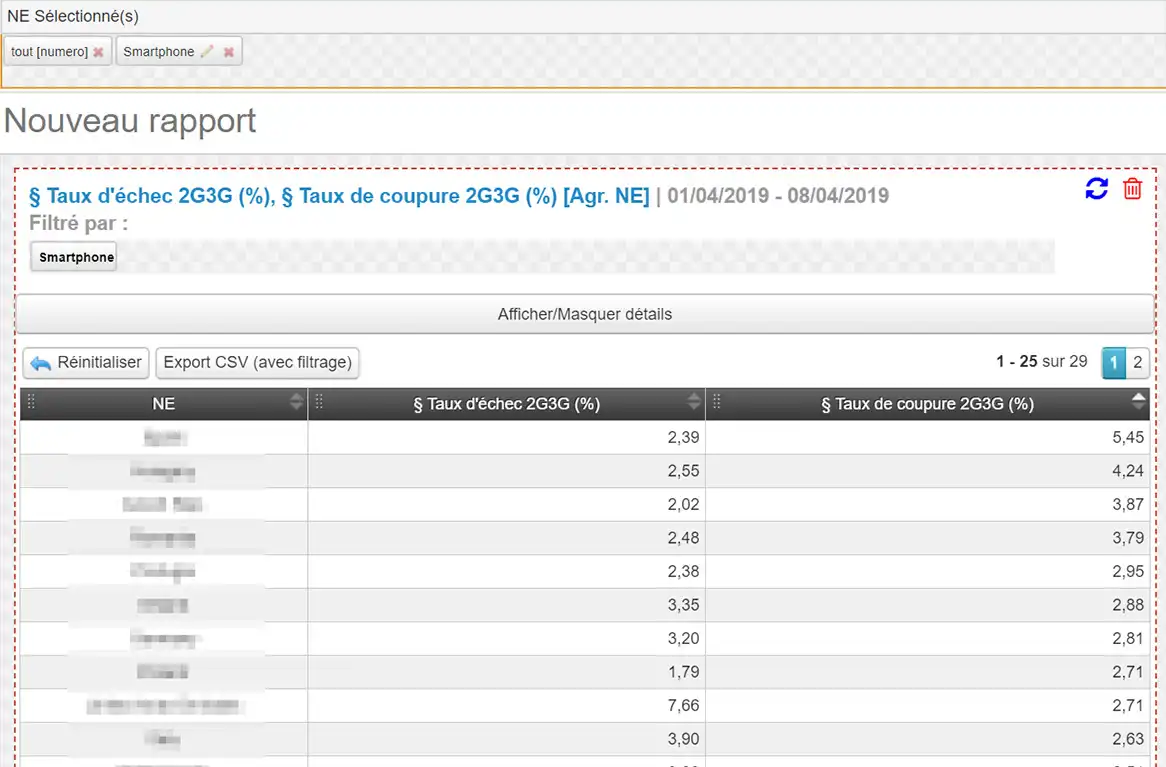
Report and manages quality for a mobile phone fleet of an enterprise customer.
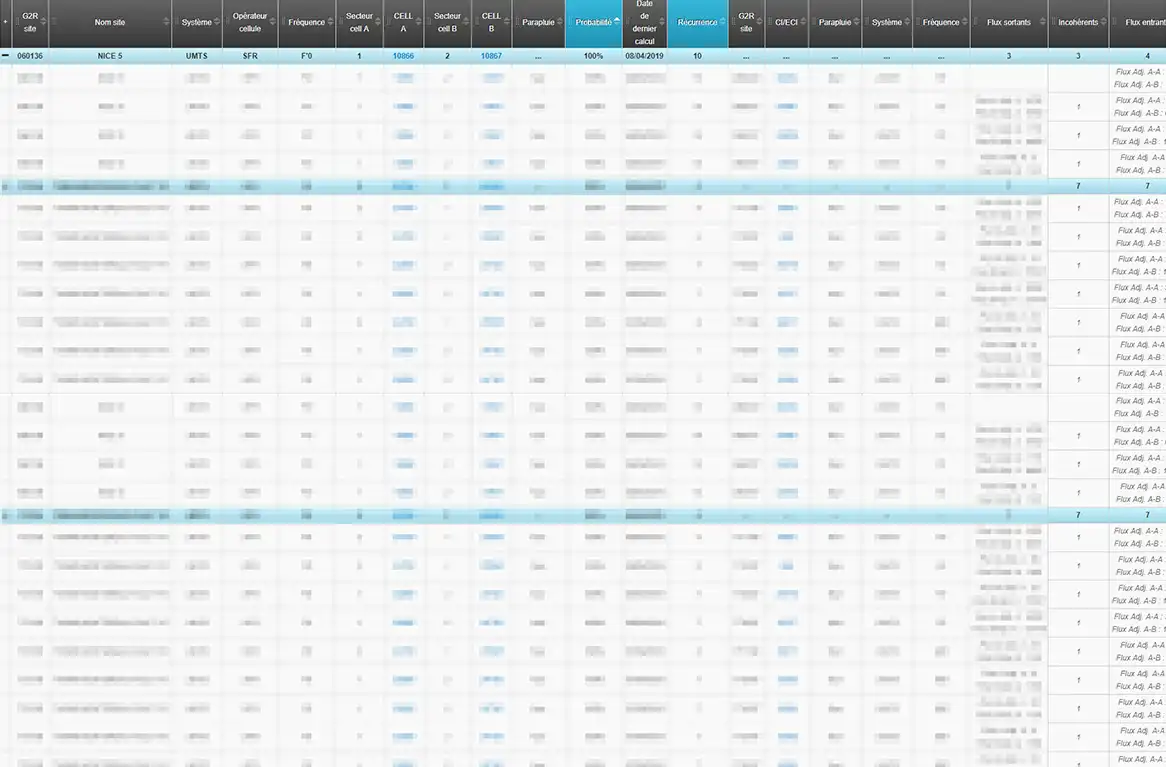
Automate tasks for mobile network optimization team.
Predict a customer satisfaction score based on technical KPIs.
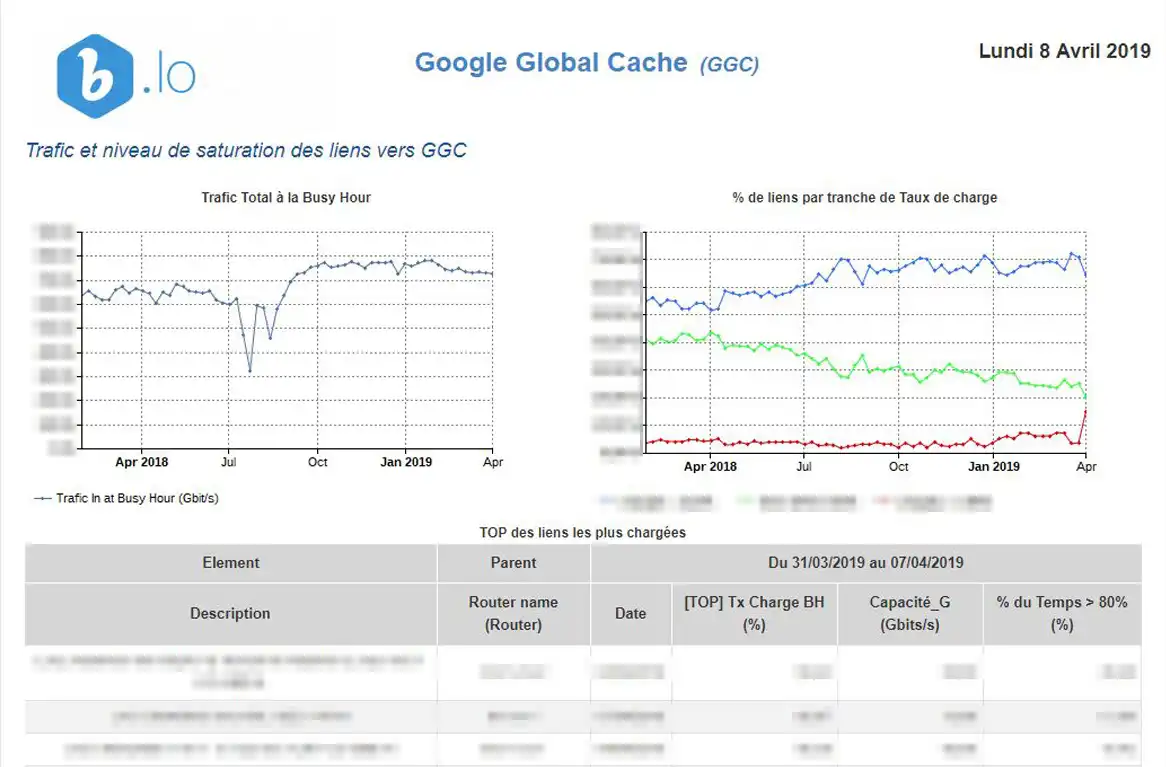
Report the core traffic redirected to Google cache.
Assess network operation quality based on before-after performance templates.
/// Analytics engines
Data science is the art of making sense of data when the set is too large to be simply handle by standard method. Both mathematical algorithms and business expertise are mandatory for credible approach. LivingObjects R&D team selected the most relevant algorithms for network performance to help network engineers build powerful insights without statistical background.

Detect
Detecting anomalies from time series is a problem known in the scientific community as the detection of new pattern and outliers. b.lo uses supervised and unsupervised recognition methods. The algorithms apply equally to all network elements.

Classify
Decision tree is an efficient algorithmic form for implementing induction learning. The visual form provides insights of large data sets in a few seconds, and the automatic construction of “if-then” mutually exclusive rules is easily interpreted.

Predict
The prediction algorithms natively embedded in b.lo provides not yet known insights by learning from past experiences. They project a time series in the future taking seasonal variation into account for capacity planning or predict a subjective indicator, such as customer satisfaction, based on measured performance indicators.
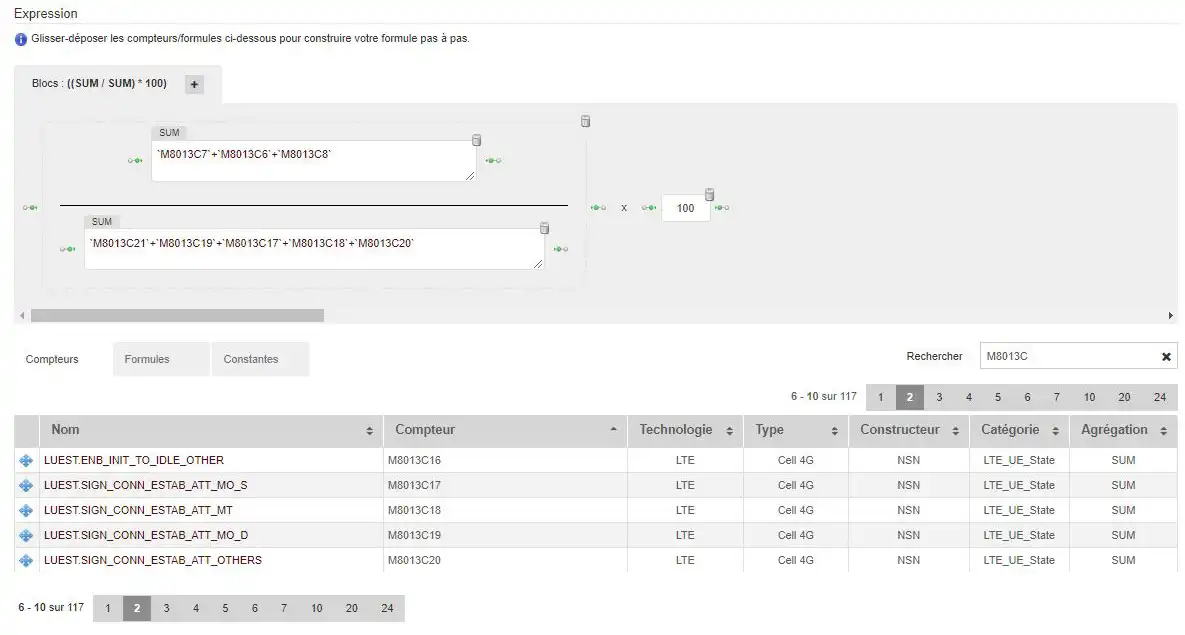
/// Interactive Visualization
As a picture often speaks better than words, LivingObjects front development team works hard alongside client engineering teams to build efficient and innovative visualization. Highly customizable, end-users build personal workspaces and share public resources among the team to automate daily operations and improve reactivity on detected problem.
Explanatory
Explanatory lean tells a predetermined story to share experience and help team be more reactive.

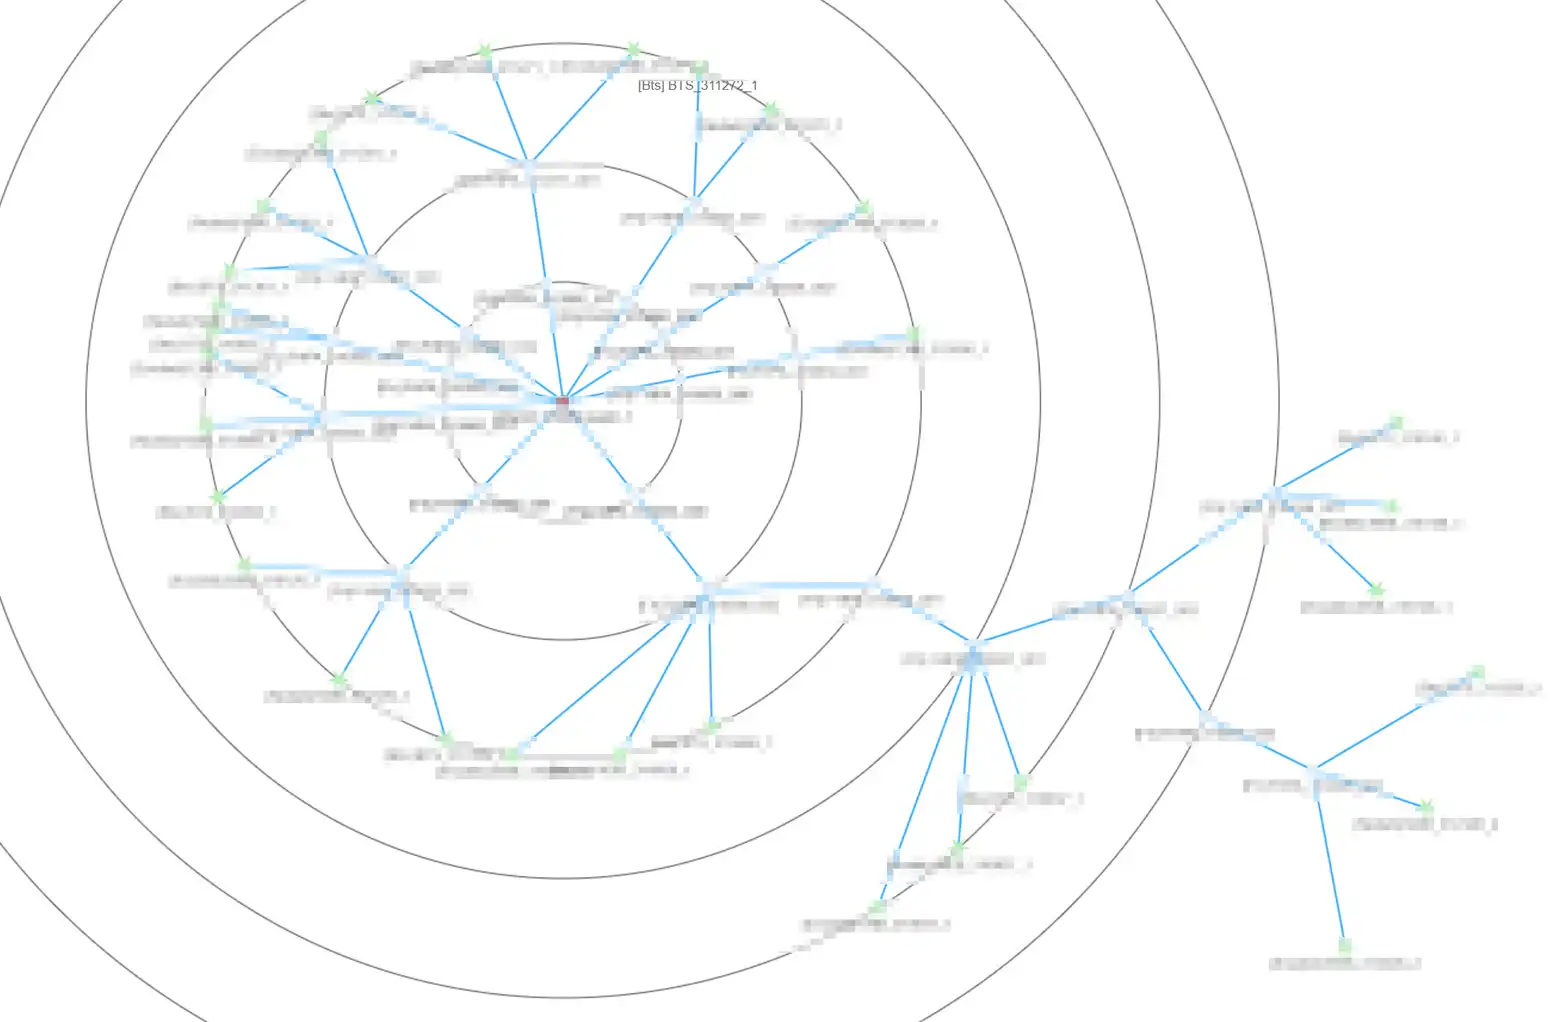
Exploratory
Interactive controls allow users to explore and discover patterns in complex datasets.
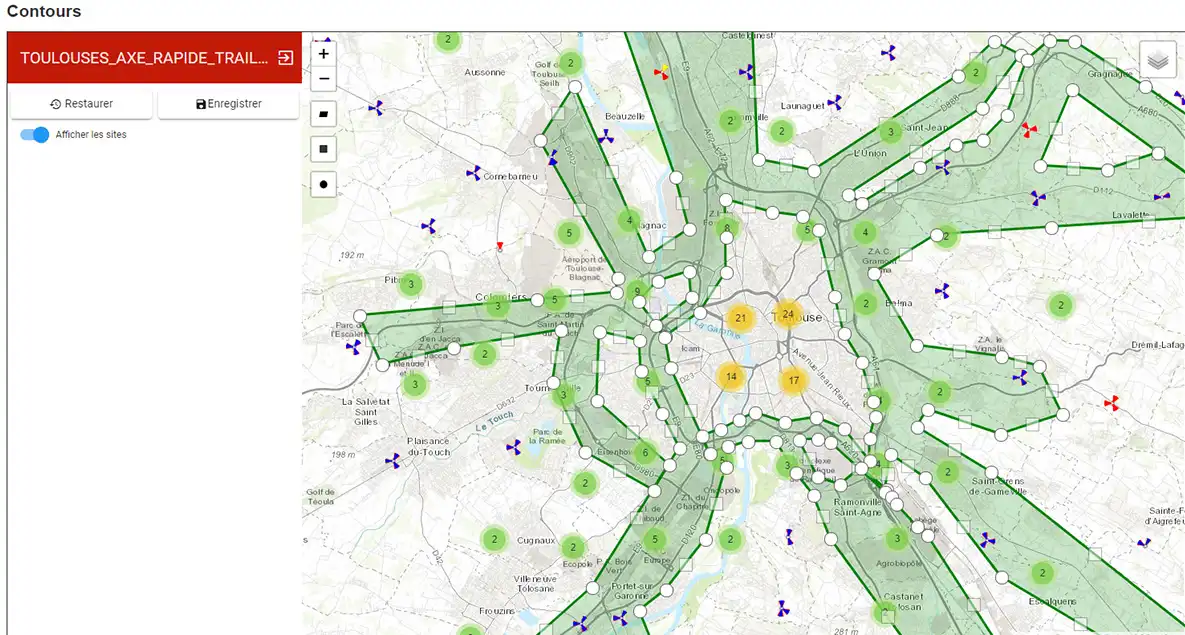
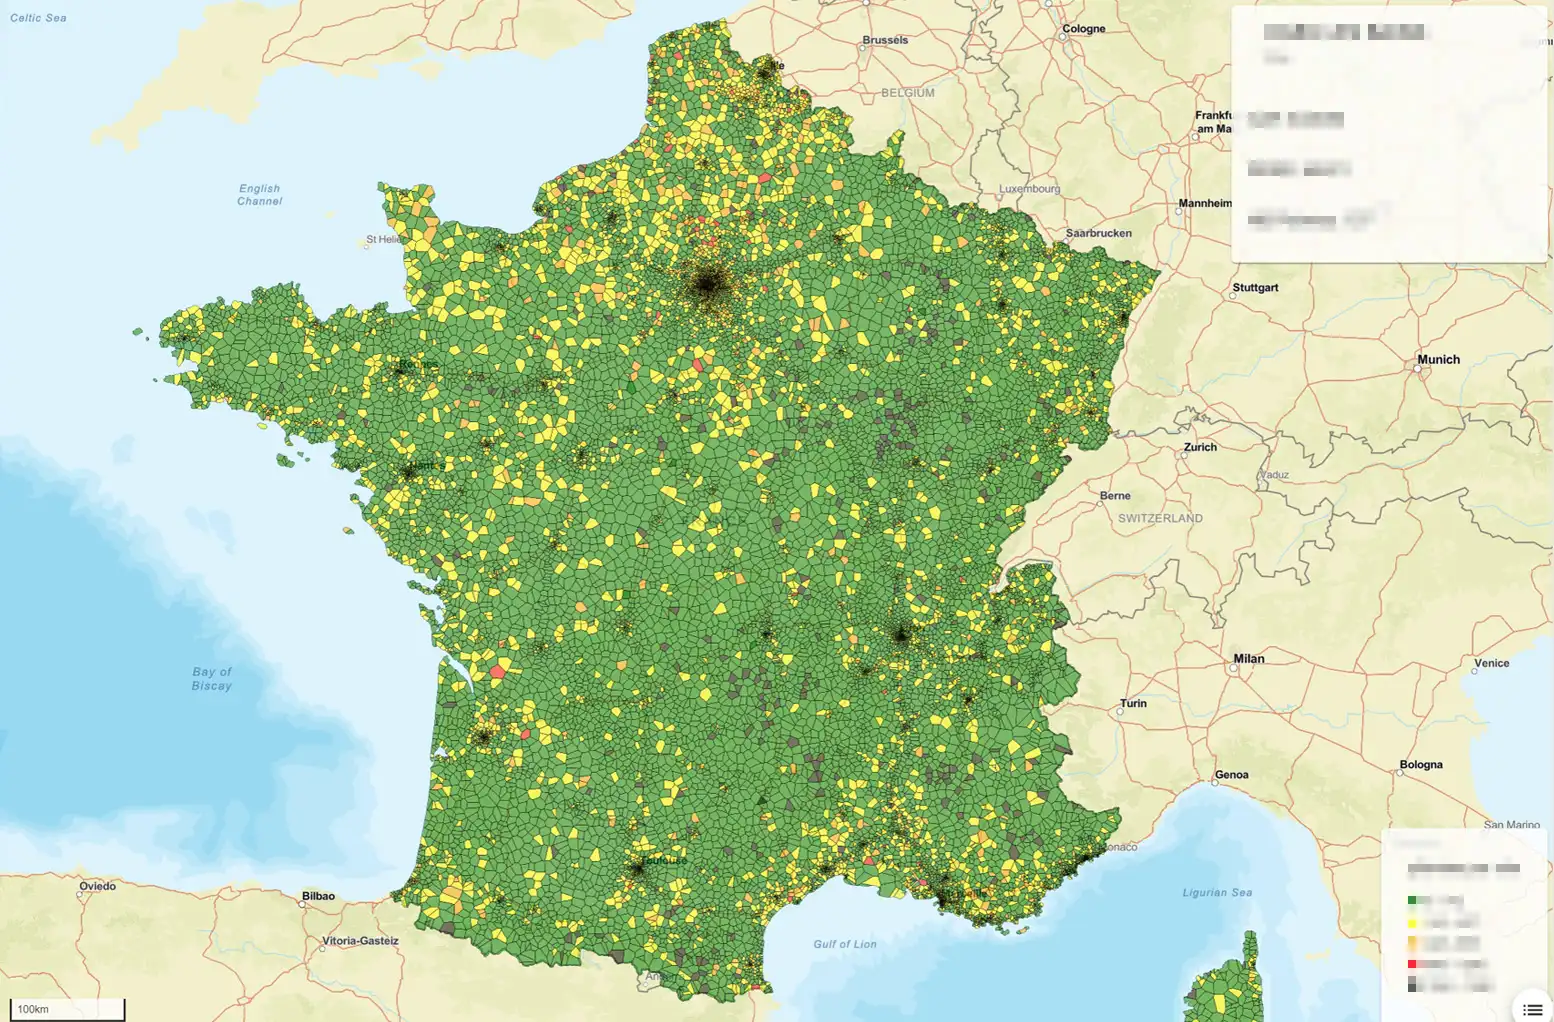
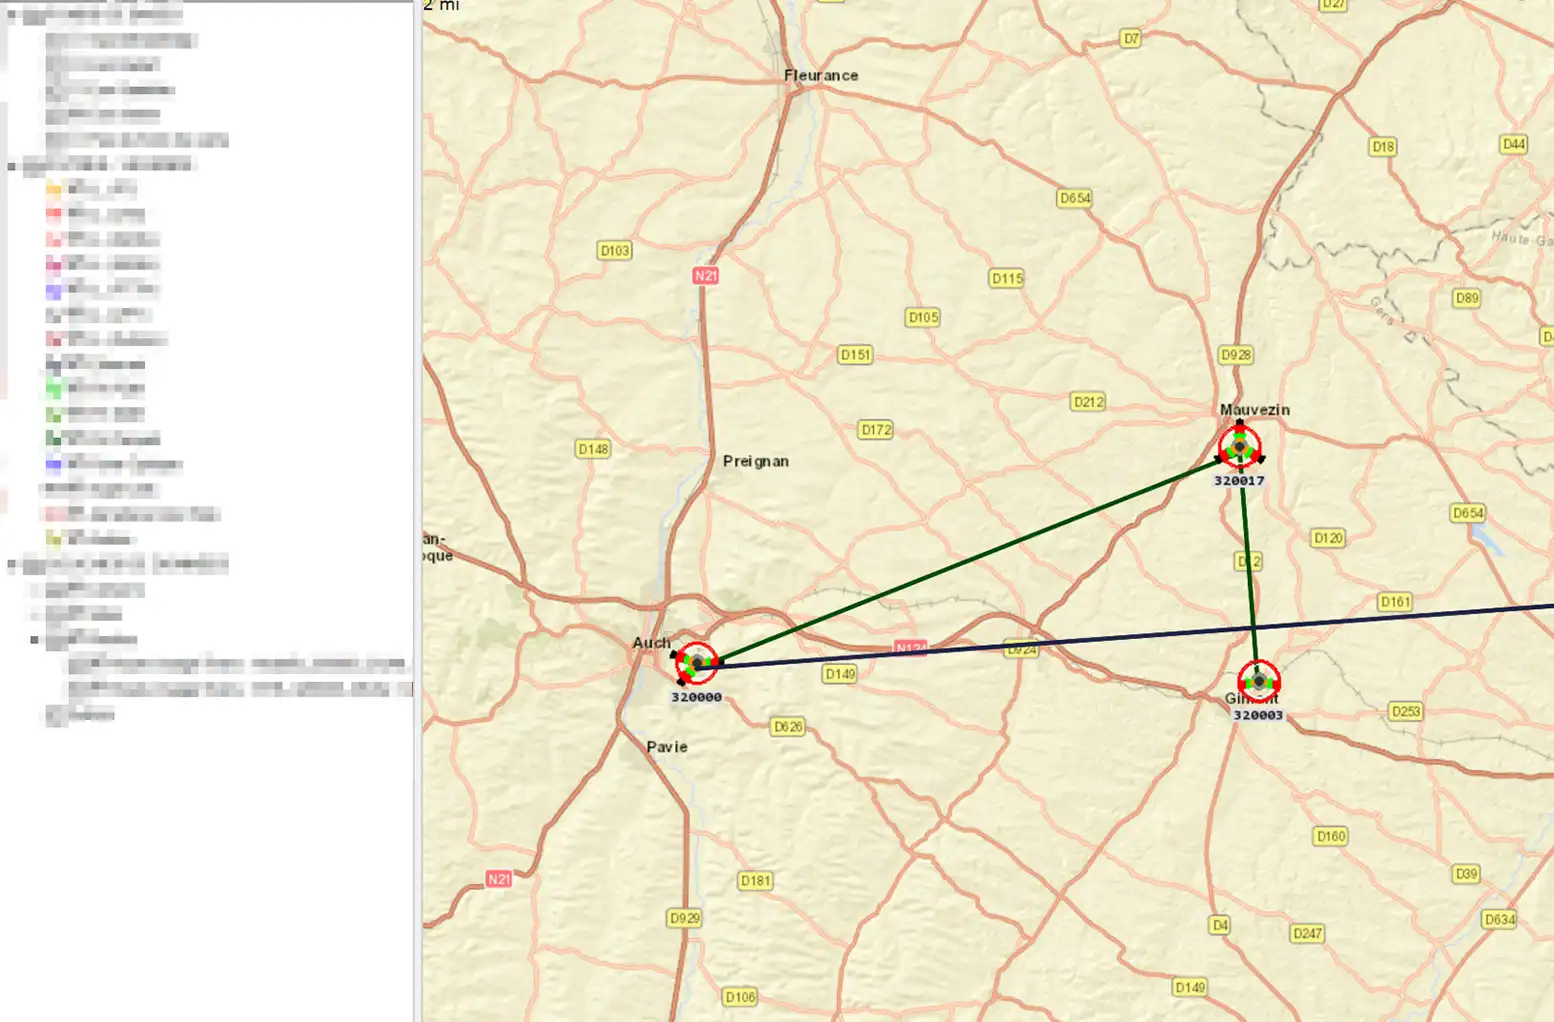
MAPs
A large set of map based tools enables network engineer or customer care to visualize mobile network performance, on going operations and browse network transmission.
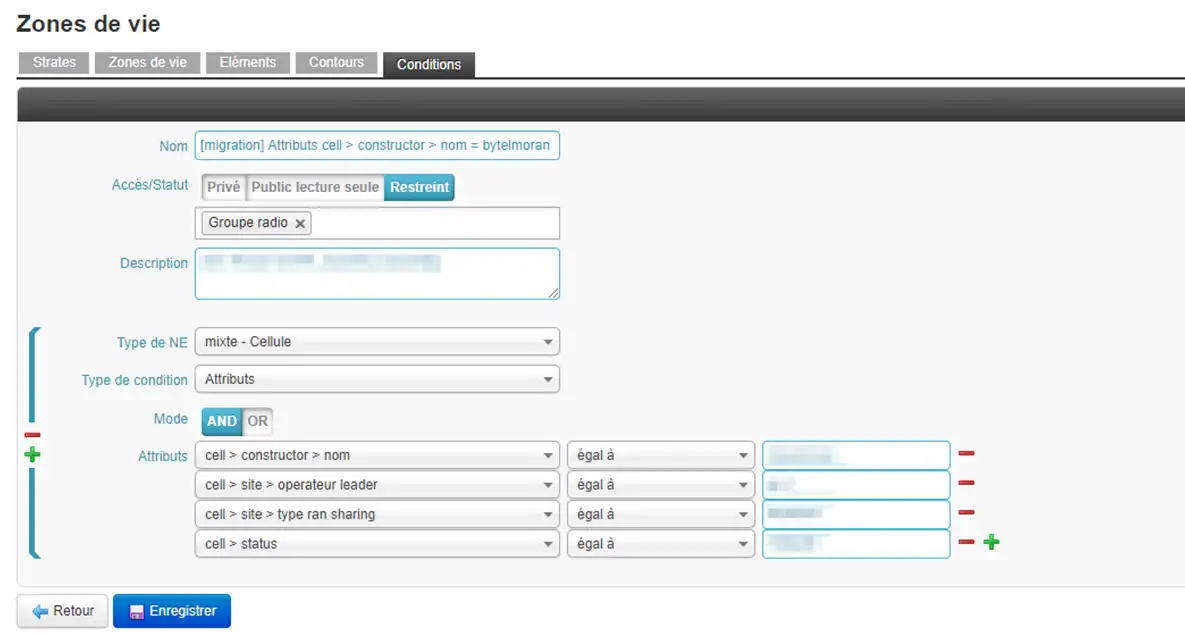
/// Data management
If knowing is half the battle, in the theater of Service Providers networks, data storage and retrieval are the other half.

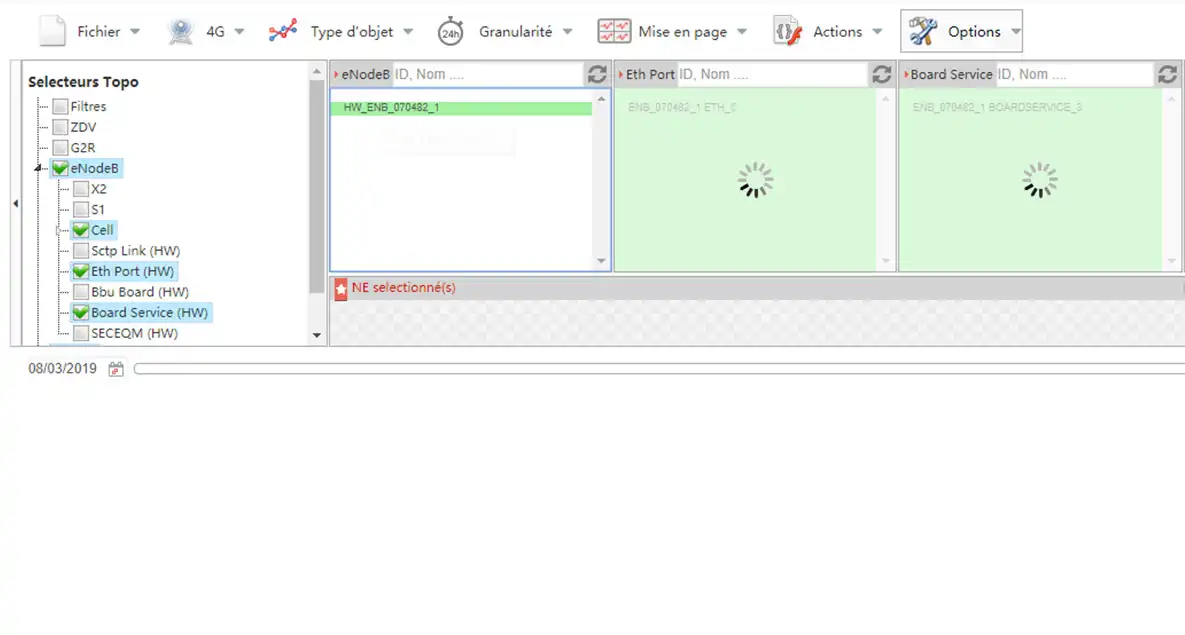
Normalize
On the shell plugins collect and normalize, in real time, any data from your heterogeneous network.
- Techno : 2G, 3G, 4G, 5G, IP, ADSL, FTTH, IMS, transport, IP TV, XDR, …
- Vendor : Nokia, Huawei, Cisco, Ericson, …
- Protocol : csv, snmp V2/V3, Netflow/IPfix, …

Scale
Typical Tier one b.lo implementation
- User accounts > 1 000
- Network nodes > 1 000 000
- CDR per day > 10 000 000
- Counters per day > 10 000 000 000
Typical Business report < 10 s

Export
Data warehouse or third party tools collect data through external b.lo APIs using web services.